Financial report / Overview of financial results
Substantial growth of revenue was mainly due to growth of carrying volumes following the acquisition
of new airline assets.
| USD millions |
2012 |
2011 |
Change, % |
| Revenue |
8,138.1 |
5,377.9 |
51 |
| Operating costs |
7,780.4 |
4,989.6 |
56 |
| Operating profit |
357.7 |
388.3 |
-8 |
| Profit before tax |
357.7 |
585.3 |
-39 |
| Tax |
191.4 |
94.0 |
104 |
| Non-controlling interest |
55.8 |
33.3 |
68 |
| Net profit |
166.3 |
491.3 |
-66 |
| EBITDA |
671 |
646 |
4 |
| EBITDA margin, % |
8 |
12 |
-4 p.p. |
| EBITDAR |
1,238 |
1,024 |
21 |
| EBITDAR margin, % |
15 |
19 |
-4 p.p. |
| Net debt/EBITDA ratio |
3.2 |
2.9 |
10 |
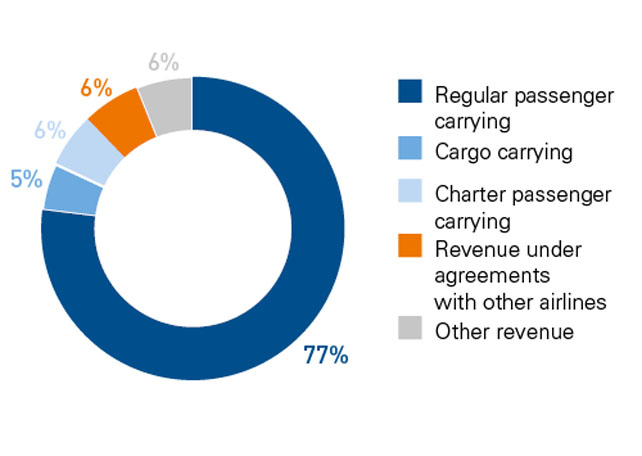
Aeroflot Group revenue Breakdown
Net income of Aeroflot Group in 2012 was USD 166.3 million, which is 66% less than in 2011. The lower bottom line in the reporting year was due to the absence in 2012 of receipts from the sale of investments in subsidiaries and affiliates which highly influenced financial income in 2011. Lower EBITDA margin of the Group in 2012 compared with 2011 was mainly due to deconsolidation of OJSC Terminal, which showed high EBITDA margin, as well as the consolidation of newly acquired companies, which have not yet been fully integrated into the Group. In comparison with other airlines EBITDA profitability of Aeroflot Group remained relatively high.
Revenue
Revenue from passenger carrying represented 83% of total Group revenue in 2012. The share of revenue under agreements with other airlines was 6% of total revenue, and the share of revenue from cargo transport was 5%.
Revenue from passenger carrying amounted to USD 6,754.5 million in 2012, which is 61% more than in 2011. Major increase of revenue from charter carrying was due to acquisition of the charter business of JSC Orenair. The Group carried 27.5 million passengers in 2012, which is a record figure.
Revenue from cargo carrying was USD 363.7 million, representing a major increase compared with 2011 (+31%).
Revenue under agreements with other airlines was USD 502.5 million, which is 13% more than in 2011.
| USD millions |
2012 |
2011 |
Change, % |
| Scheduled passenger flights |
6,247.0 |
4,109.9 |
52 |
| Cargo |
363.7 |
277.7 |
31 |
| Charter passenger flights |
507.5 |
78.1 |
550 |
| Airline revenue agreements |
502.5 |
445.6 |
13 |
| Other revenue |
517.4 |
466.6 |
11 |
| Total |
8,138.1 |
5,377.9 |
51 |
Operating costs
The following items account for the largest shares of costs:
- Aviation fuel — 29%
- Staff costs — 16%
- Aircraft and traffic servicing — 16%
Group operating costs in 2012 were USD 7,780.4 million, which is 56% more than in 2011. The growth of costs was mainly due to higher carrying volumes in 2012. Increase in the number of personnel was mainly due to increase of air crew numbers at JSC Aeroflot, associated with fleet expansion, as well as recruitment of staff at CJSC Aeromar due to the opening of a branch in St. Petersburg at the end of 2011. Labour productivity was substantially improved in 2012, both at JSC Aeroflot and throughout the Group. Revenue per full-time employee rose by 12% to USD 293,000.
| USD million |
2012 |
2011 |
Change, % |
| Aviation fuel |
2,287.5 |
1,472.2 |
55.4% |
| Staff costs |
1,241.8 |
870.1 |
42.7% |
| Aircraft and traffic servicing |
1,274.2 |
753.8 |
69.0% |
| Maintenance |
601.7 |
336.5 |
78.8% |
| Sales and marketing |
353.6 |
236.0 |
49.8% |
| Operating lease expenses |
567.0 |
378.4 |
49.8% |
| Depreciation and amortisation |
269.1 |
221.1 |
21.7% |
| Administration and general expenses |
255.2 |
210.5 |
21.2% |
| Passenger services |
158.9 |
96.0 |
65.5% |
| Communication expenses |
150.9 |
122.4 |
23.3% |
| Food and beverages |
117.0 |
89.5 |
30.7% |
| Cost of duty free goods sold |
79.8 |
63.5 |
25.7% |
| Customs duties |
44.6 |
36.2 |
23.2% |
| Insurance expenses |
40.5 |
29.7 |
36.4% |
| Other expenses |
338.6 |
73.7 |
359.4% |
| Total |
7,780.4 |
4,989.6 |
55.9% |
EBITDA
Group EBITDA increased by 4% in 2012 compared with 2011 to USD 671 million. EBITDA margin declined from 12% in 2011 to 8% in 2012, due to work on integration of newly acquired airline assets, which has not yet been completed.
Financial income and expenses
Financial income of the Group declined by more than two times in 2012 and amounted to USD 166.4 million. The lower figure was mainly due to the absence in 2012 of receipts from the sale of investments in subsidiaries and affiliates which highly influenced financial income in 2011.
Financial expenses in the reporting year were USD 166.7 million. Lowering of financial expenses by 32% was due to decline of interest expenses on loans as well as the absence in 2012 of losses due to exchange rates fluctuations
| Financial income |
2012 |
2011 |
Change, % |
| Net income from exchange rate differences |
89.2 |
— |
100% |
| Interest income on bank deposits |
13.9 |
14.8 |
-6% |
| Income from hedging instruments |
13.3 |
— |
100% |
| Income from sale and depreciation of investments |
— |
424.0 |
-100% |
| Income from revaluation of hedging instruments |
— |
1.5 |
-100% |
| Other financial income |
50.0 |
— |
100% |
| Financial income |
166.4 |
440.3 |
-62% |
| Financial сosts |
|
|
|
| Interest expenses on short- and long-term borrowings |
56.6 |
114.0 |
-50% |
| Interest expenses under financial lease agreements |
52.7 |
15.7 |
236% |
| Losses from revaluation of hedging instruments |
33.0 |
— |
100% |
| Foreign exchange loss |
— |
113.8 |
-100% |
| Losses from sale and depreciation of investments |
10.0 |
— |
100% |
| Losses on hedging instruments |
11.2 |
— |
100% |
| Other financial expenses |
1.6 |
— |
100% |
| Interest expenses in discounting of customs duties |
1.6 |
0.7 |
129% |
| Financial costs |
166.7 |
244.2 |
-32% |
Net profit
Net profit of the Group in 2012 declined by 66 % to USD 166.3 million.
Lower net profit in the reporting year was due to the absence in 2012 of receipts from the sale of investments in subsidiaries and affiliates which highly influenced financial income in 2011.
Base earnings per share in the reporting year were USD 0.213 compared with USD 0.519 in 2011.
Yields
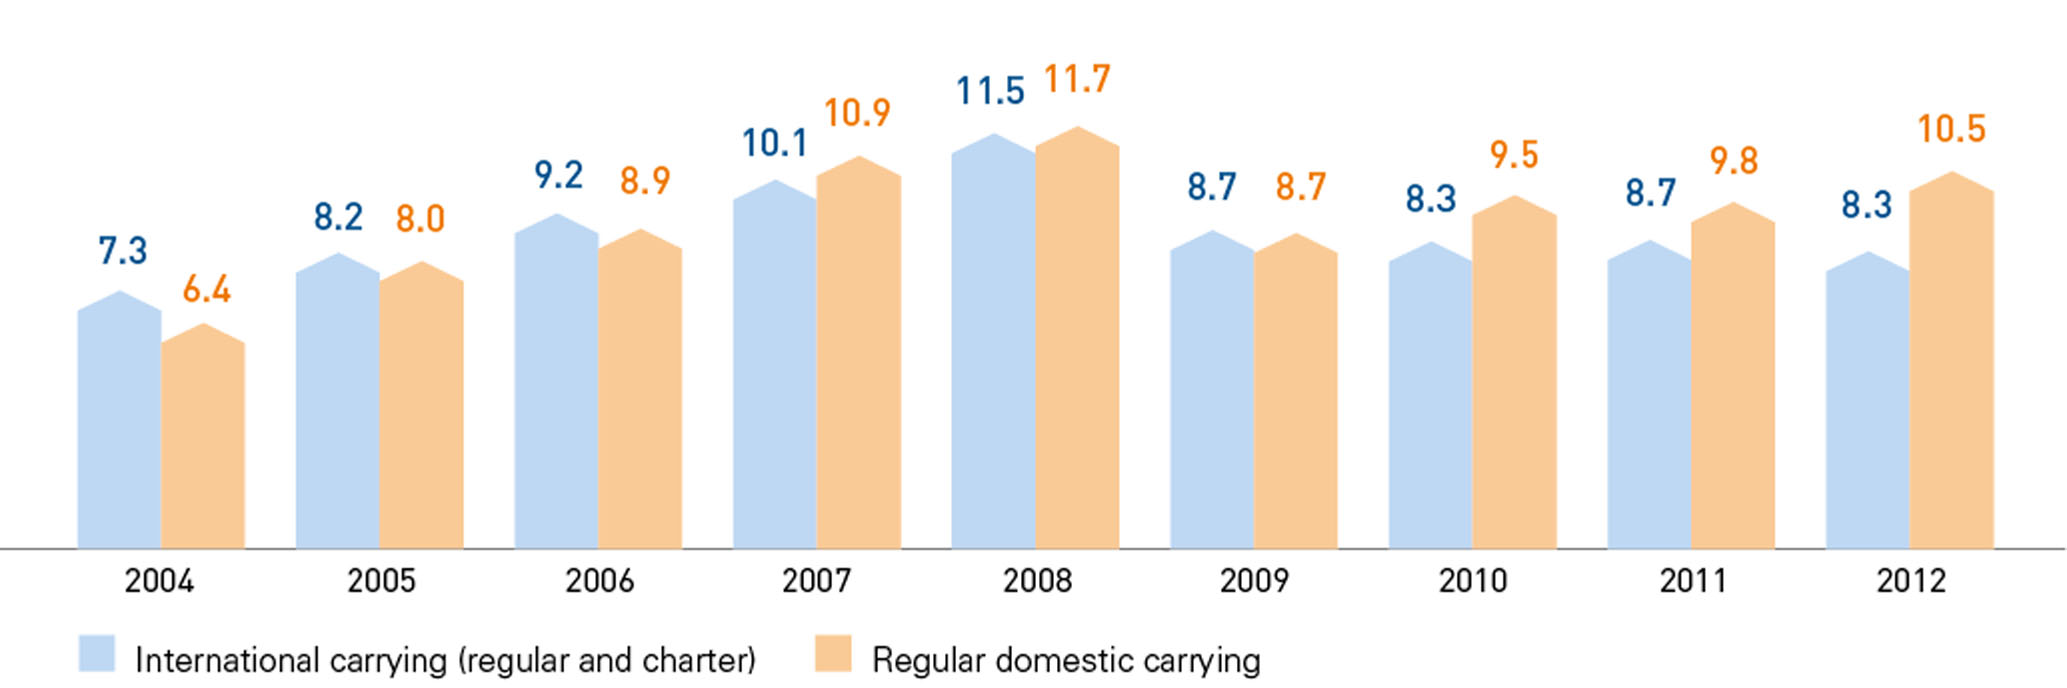
Yields rose in 2012 on domestic routes, but experienced a slight decline on international routes (due mainly to a decline of yield on routes to Europe from 12.5 to 12.1 US cents).
Yields from passenger carrying, US cents/PKM
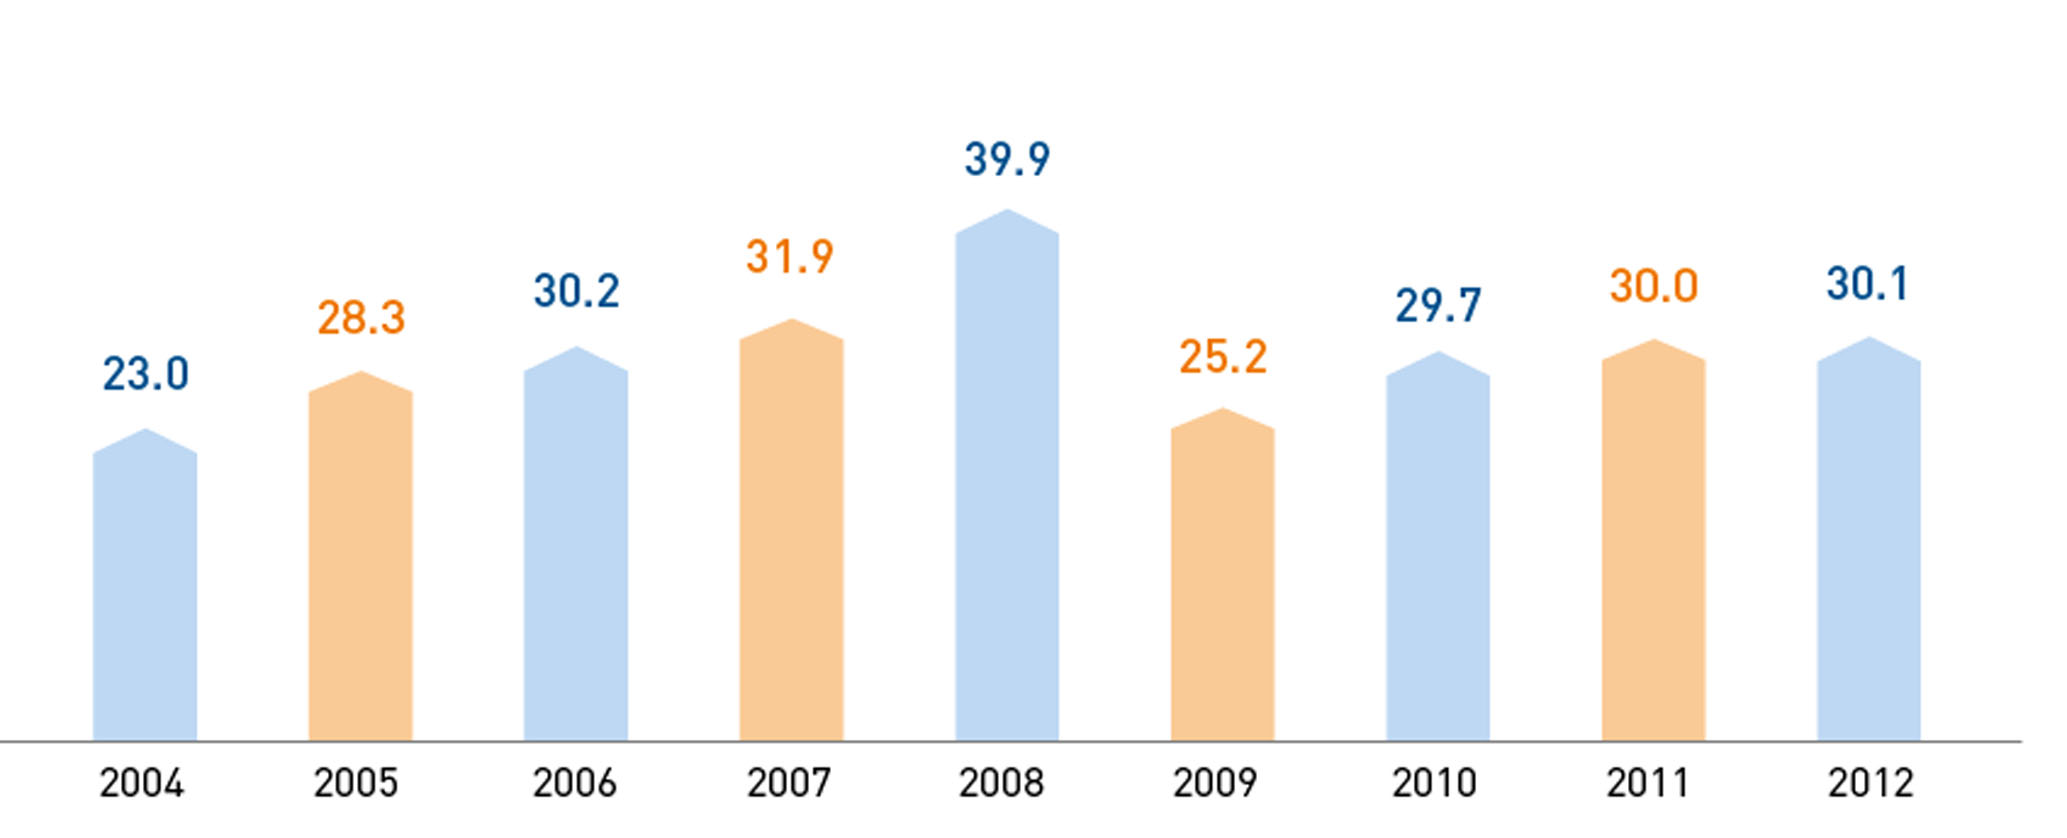
Yields from cargo carrying, US cents/TKM
DEBT
| USD million |
2012 |
2011 |
Change |
| Loans and borrowings |
706 |
767 |
-8% |
| Financial lease liabilities |
1,882 |
1,500 |
25% |
| Pension liabilities |
15 |
12 |
25% |
| Customs duties |
19 |
18 |
6% |
| Total debt |
2,622 |
2,297 |
14% |
| Cash and short-term investments |
501 |
414 |
21% |
| Total net debt |
2,121 |
1,883 |
13% |
Total debt of the Group increased by 14% in 2012. Short-term loan facilities in the reporting year were provided by City Bank, Gazprombank, Sberbank, BFA Bank, Petrocommerce Bank, Far East Bank, Transcreditbank, Bank Iturup, Forshtadt Bank, and by means of a bond issue. Total short-term borrowings as of December 31, 2012 were USD 466.0 million, of which USD 24.3 million were denominated in US dollars. The remainder was denominated in roubles, with the exception of USD 1.3 million denominated in other currencies. Loans were mainly intended for replenishment of working capital and were provided at both fixed and floating rates of interest.
Long-term debt of the Group as of December 31, 2012 totaled USD 240.0 million.
Interest expenses on short-term and long-term loans and credits in 2012 totaled USD 56.6 million. Interest expenses on financial leases were USD 52.7 million in the reporting year
| Non-operating liabilities: |
Average interest rate |
| Contract rate |
Effective rate |
| Loans in foreign currency |
3.7% |
3.7% |
| Loans in Russian roubles |
11.2% |
11.2% |
| Bond loans |
7.8% |
7.6% |
| Financial lease liabilities |
3.7% |
3.7% |
| Customs duties |
0% |
10.8% |
Liquidity
The Group has maintained strong levels of liquidity. Cash and short-term investments totaled USD 500.9 million at the end of 2012 (21% more than at the end of 2011). Cash flow from operations was USD 540.6 million (USD 369.2 million in 2011). Net debt/EBITDA was 3.2 (2.9 in 2011). The current ratio was 1.04.
Dividends
On May 24, 2013 the Board of Directors decided to recommend the Annual General Meeting of Shareholders to pay dividends of RUB 1.1636 per common share. The total amount allocated for dividends for 2012 was therefore about USD 41.6 million at the average exchange rate of the year 2012. The Annual General Meeting on June 24, 2013 approved the proposed level of dividends for 2012.
CAPITAL EXPENDITURES
| USD million |
2012 |
2011 |
| Construction in progress |
81.0 |
54.7 |
| Acquisition, leasing and modernization of aircraft |
684.8 |
318.4 |
| Acquisition of vehicles and equipment |
58.6 |
15.3 |
| Acquisition of and repairs to buildings and facilities |
4.2 |
2.5 |
| Total |
828.6 |
390.9 |
Capital expenditures in 2012 were USD 828.6 million. Main items in 2012 were delivery of five А-330s and three Airbus А-321s, obtained under financial leasing contracts, with total balance-sheet value of USD 670.2 million.

")
")